Dirga Raj Lama
Web Developer
Fixing a Slow Website: Before vs After Performance
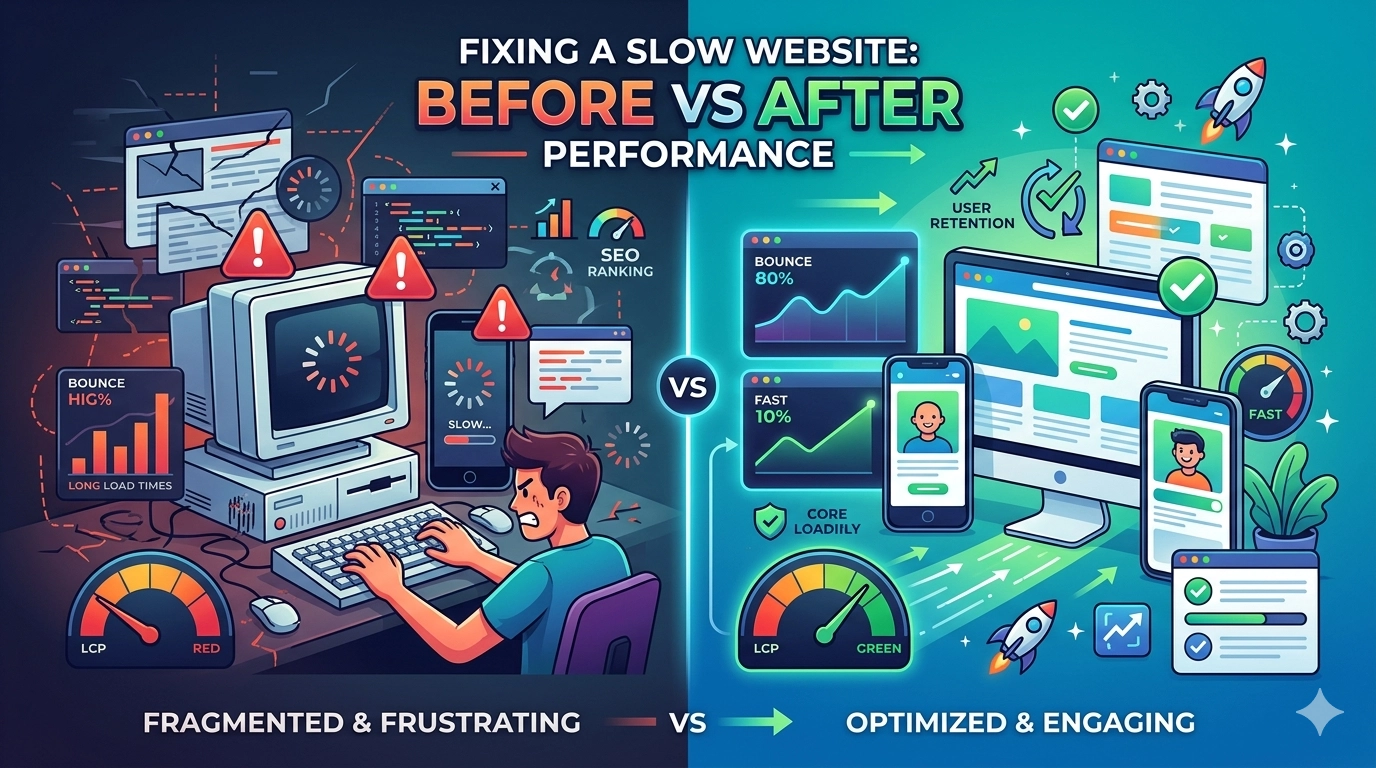
In the fast-paced digital economy of 2026, a single second can be the difference between a loyal customer and a bounced visitor. If you are currently fixing a slow website, you already know that performance is more than just a technical metric—it is a core pillar of user experience and search engine visibility. Google’s algorithms have evolved to prioritize “Page Experience” through Core Web Vitals, making speed a non-negotiable factor for ranking. By analyzing the “before vs. after” metrics of a typical optimization project, we can see exactly how technical debt drags down a business and how strategic fixes can skyrocket engagement and conversion rates.
The “Before” Scenario: A Case Study in Friction
Before starting the process of fixing a slow website, most site owners face a common set of symptoms: high bounce rates, low average session durations, and declining mobile traffic. When we audit a “slow” site, the technical landscape usually looks like this:
- Bloated Images: Large, uncompressed high-resolution photos that take seconds to render.
- Render-Blocking Resources: CSS and JavaScript files that stop the page from showing content until they are fully loaded.
- Excessive Plugins: Particularly in WordPress environments, where unnecessary scripts fire on every page.
- Slow Hosting: A server response time (TTFB) exceeding 600ms.
In this state, a website often has a Largest Contentful Paint (LCP) of 4.5 seconds or more. According to industry standards, anything over 2.5 seconds is considered poor. Users on 4G or 5G connections will likely abandon the page before the first meaningful image even appears.
The Optimization Roadmap
To bridge the gap between “Before” and “After,” we implement a multi-layered optimization strategy.
1. Image Modernization
We replace legacy formats (JPEG/PNG) with next-gen formats like WebP or AVIF. This usually reduces file sizes by 60-80% without a visible loss in quality. We also implement lazy loading, so images only load as the user scrolls down.
2. Code Minification and Bundling
By removing whitespace, comments, and unused code from CSS and JS files, we reduce the total payload the browser has to download. In 2026, using modern bundlers like Vite or specialized plugins ensures that only the necessary code is delivered for the specific page being viewed.
3. Server-Side Improvements
We often migrate clients to LiteSpeed servers or implement advanced Object Caching (like Redis). This significantly drops the Time to First Byte (TTFB), which is the foundation of a fast-loading site.
The “After” Scenario: The Speed Revolution
Once the work of fixing a slow website is complete, the transformation is often startling. The “After” state isn’t just about a green score in PageSpeed Insights; it’s about the tangible change in how the browser handles the site.
Key Metric Improvements:
- LCP (Largest Contentful Paint): Dropped from 4.8s to 1.2s.
- CLS (Cumulative Layout Shift): Reduced to near zero by reserving space for images and ads.
- INP (Interaction to Next Paint): Improved responsiveness, making the site feel “snappy” on mobile devices.
When the technical barriers are removed, the user experience flows naturally. Instead of waiting for elements to “pop in,” the user sees the content immediately, leading to a massive reduction in “rage clicks” and exits.
Business Impact: Beyond the Technical
Fixing a slow website has a direct correlation with your bottom line. Data consistently shows that:
- SEO Ranking Boost: As your Core Web Vitals move into the “Green” zone, Google is more likely to reward you with higher placements in the SERPs.
- Increased Conversions: For e-commerce sites, a 1-second improvement in load time can increase conversion rates by up to 20%.
- Lower Ad Costs: Faster landing pages improve your “Quality Score” in Google Ads, often leading to a lower Cost Per Click (CPC).
Tools for Measuring Your Success
To track your “Before vs After” progress, use these industry-standard tools:
- Google PageSpeed Insights: For a quick look at lab and field data.
- GTmetrix: To see a waterfall chart of exactly which files are slowing you down.
- DebugBear: For consistent monitoring of performance regressions over time.
Conclusion
The journey of fixing a slow website is one of the most high-impact investments a business can make in 2026. While the “Before” state is characterized by frustration and lost revenue, the “After” state provides a streamlined, professional, and high-converting platform. Don’t let a slow server or unoptimized code be the reason your competitors outrank you. Start your audit today, identify your bottlenecks, and watch your performance metrics—and your business—reach new heights.